Creating a Data Story
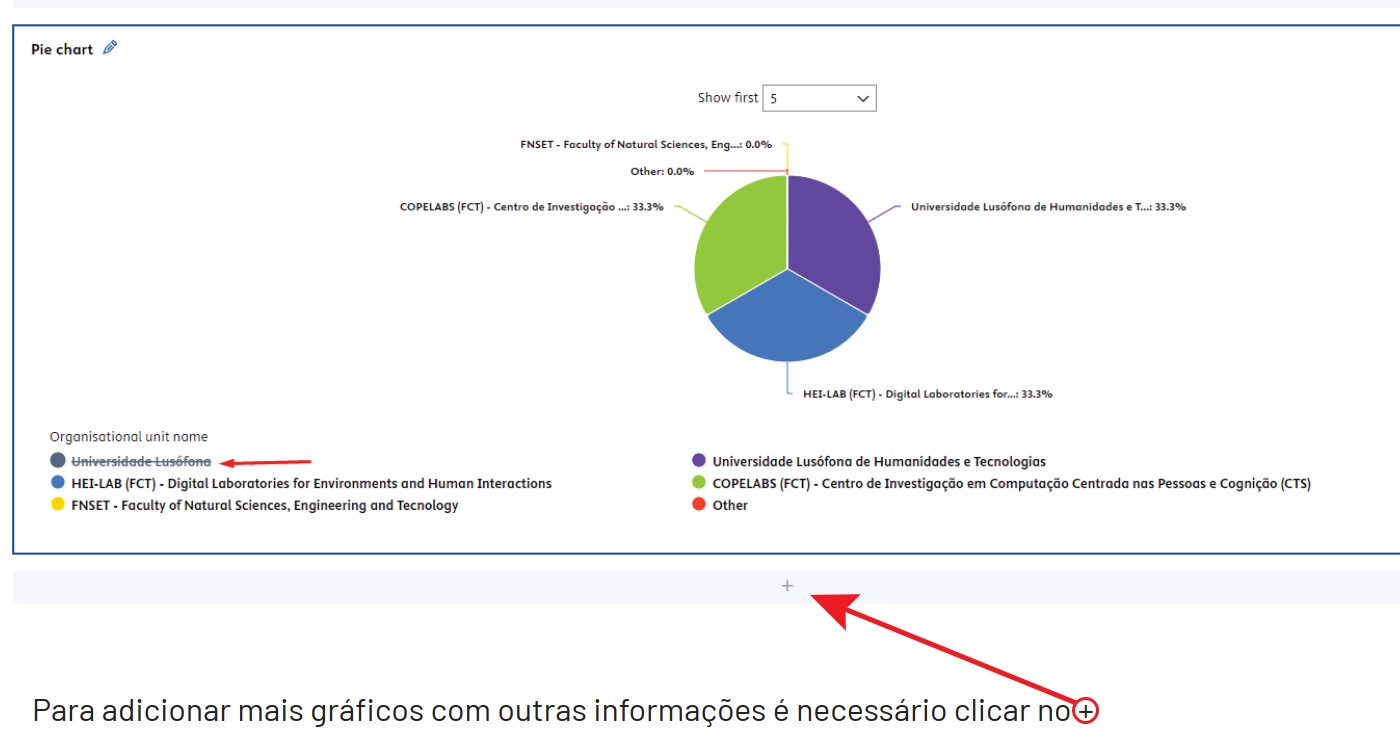
To view your report in “My Workspace”, create a “Data Story”. Choose how the information will be displayed: text, pie charts, tables, lists, etc.

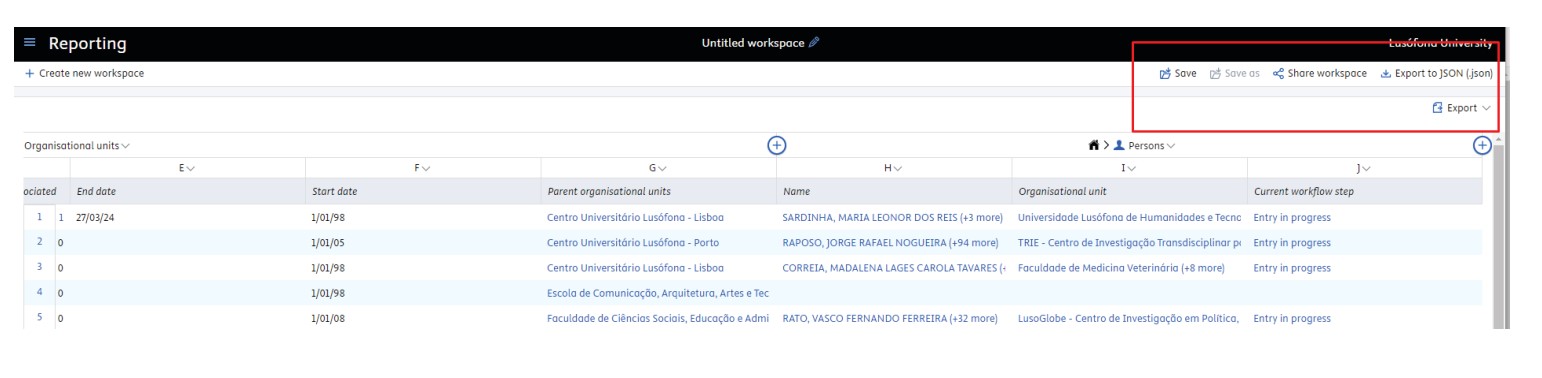
Select the parameters that best define the data you want to view or analyze.
Note: You can only choose one parameter from each column (see example below)


If you don't want certain information to be visible, you can hide it by clicking on it.
To save your workspace, click on “save” in the top right-hand corner. You also have the option of sharing your workspace and exporting it in .json, .xlxs and .cvs formats.
When you save, you will be asked for a mandatory title and, optionally, a description and category.

To access your workspaces in the report, click on “My workspaces” and you'll be able to see all the workspaces you've created with their graphics.

Mais informações: research@pure.ulusofona.pt
Descarregar (pdf)