Creating a Data Table
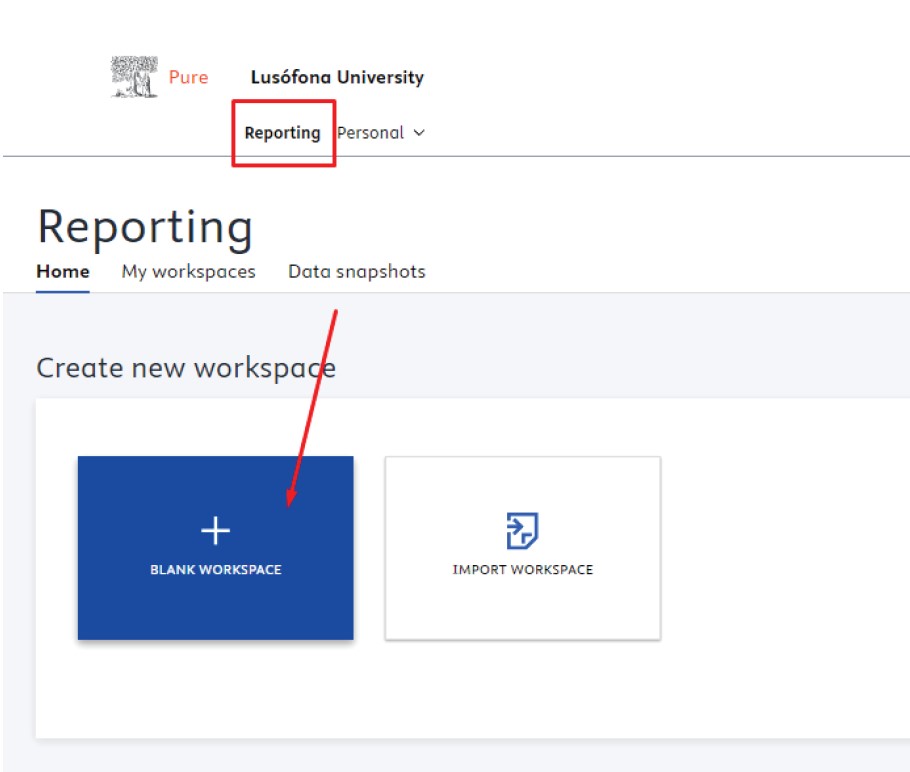
To create a workspace, go to “reporting” in the menu and click on “+ Blank Workspace”, as shown in the image.
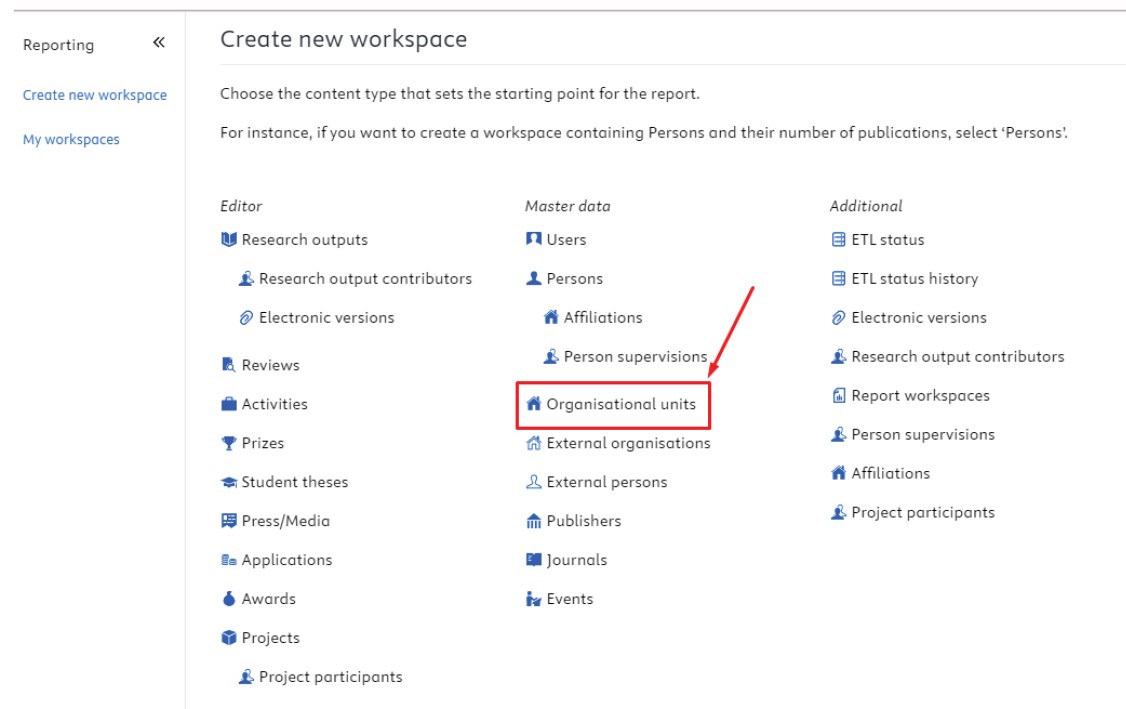
Once the new window has opened, select the points you consider most relevant to your workspace and click on “Apply” so that the selected information is available.
Example: We started by choosing the organizations
To add information to the column, you need to select the points you think are most relevant to your workspace.
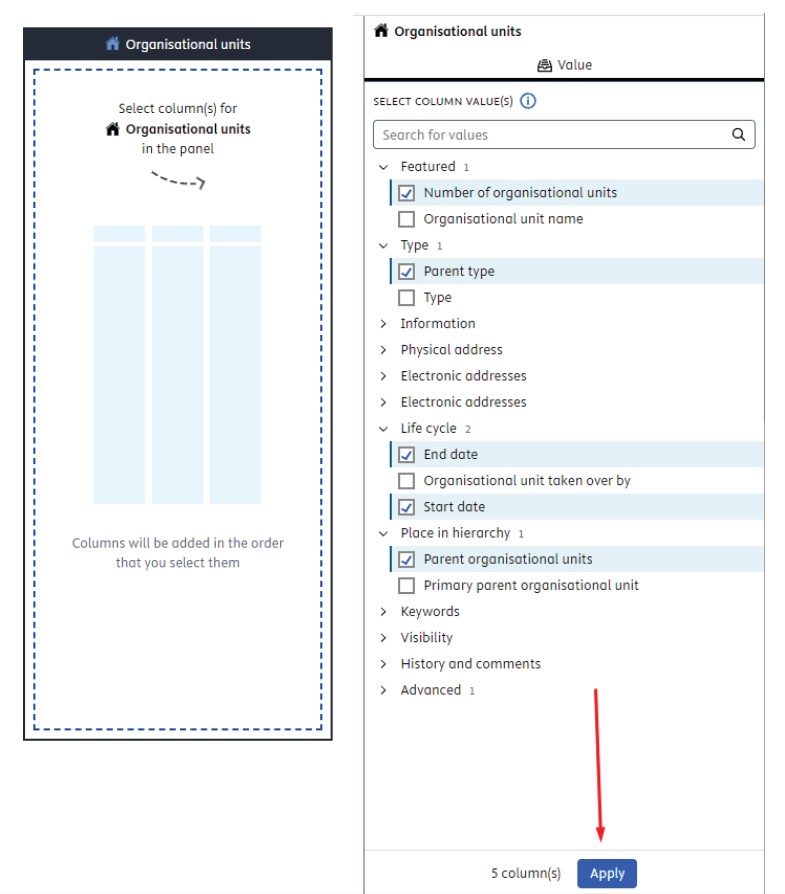
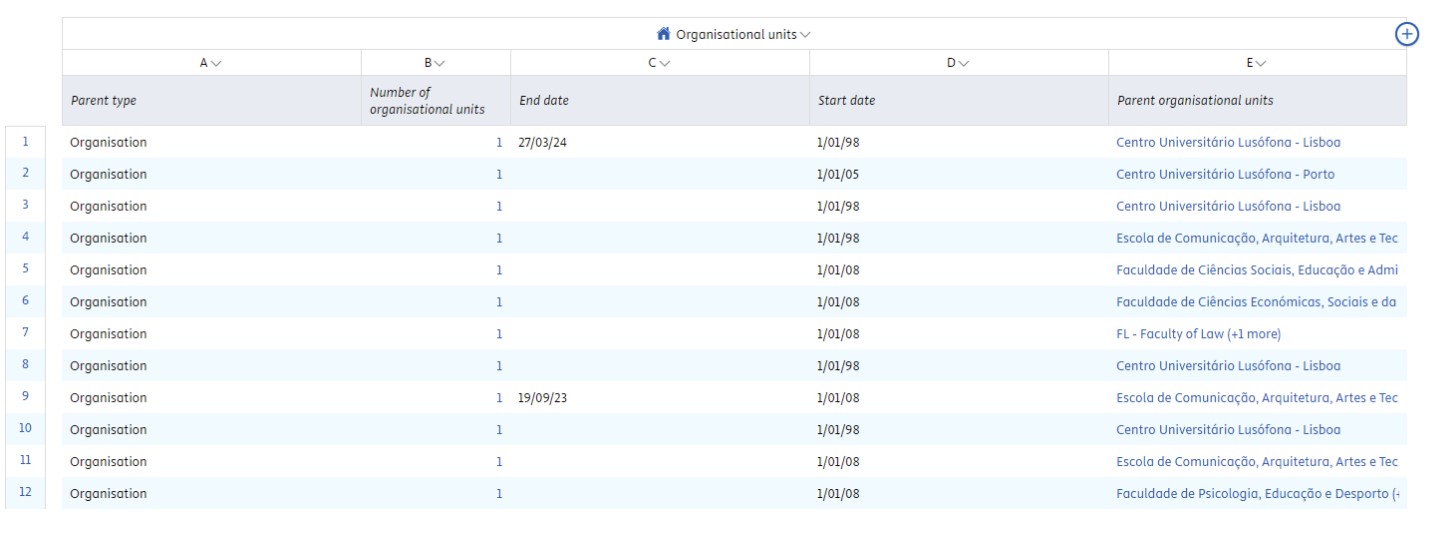
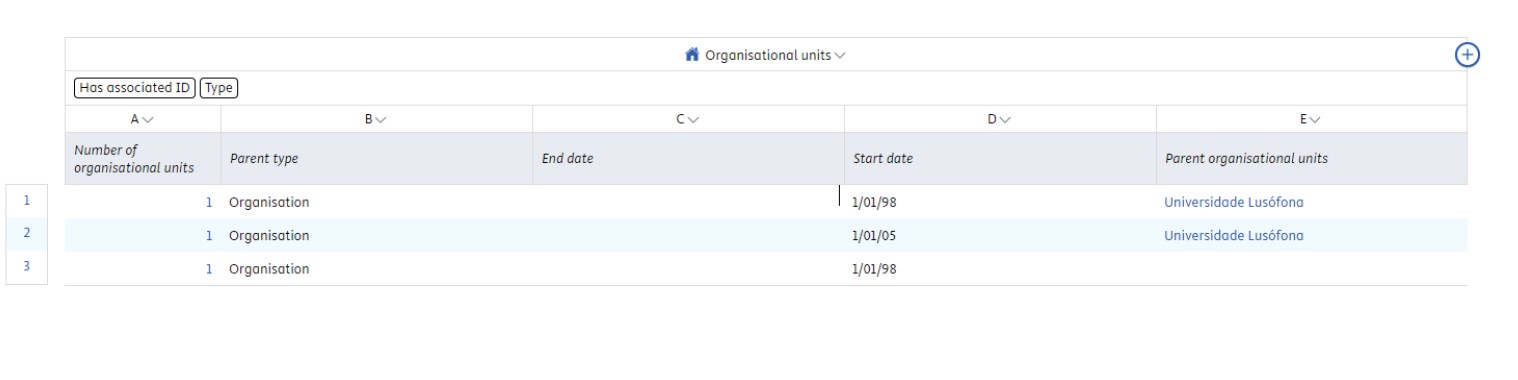
Once you have selected all the points you want, for the information to be available click on “Apply” and you will have something similar to the image below.
In the “Organizational units” bar, you can add filters to modify the presentation of the information. Click on “Add filter” and choose the filters you want to apply.


Once you have chosen your filters, click on “Apply” and your options will be saved.
You have the option of placing more than one piece of content in the workspace.
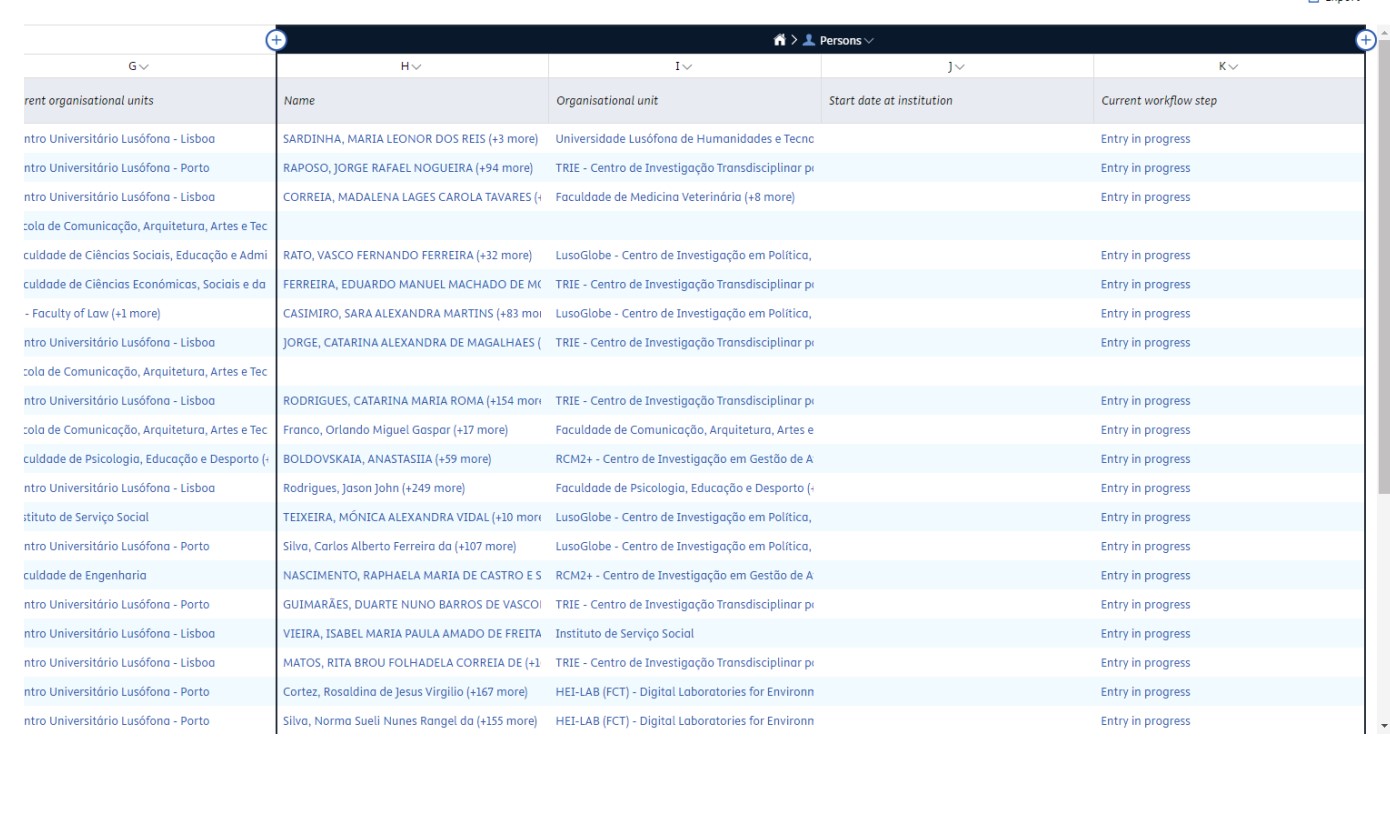
Note: When new content is added, the information is limited to the content previously chosen in the table, except in the first column.
When you add a person to the column, it comes from the organizations. And as we can see in the image below, the projects come from the persons who consequently come from the organizations.

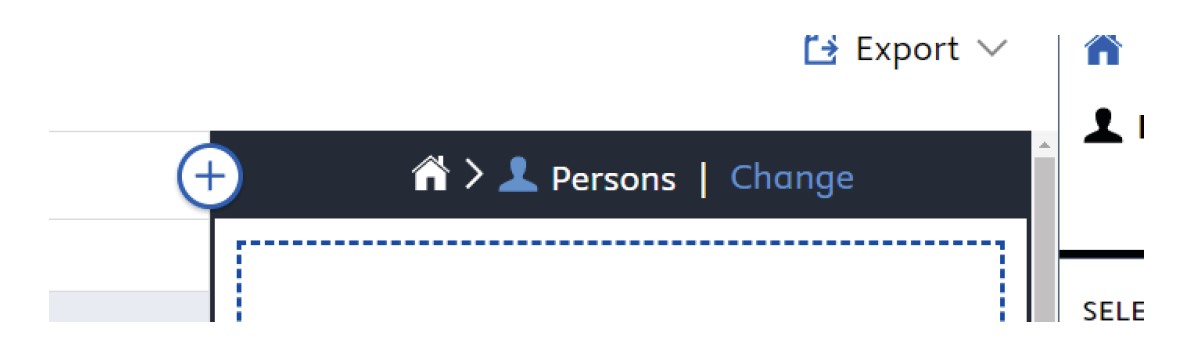
To add a new column to the table, click on the + button and choose the information it belongs to.

The process of adding information is repeated.

If there is no information in a column, you can remove it by clicking on it and selecting the “Remove column” option.

To make this data visible in “My Workspaces” you will need to create a “Data Story”. To do this, access the following pdf “How to create Data Stories”.
Mais informações: research@pure.ulusofona.pt
Descarregar (pdf)